
The critical value is the value or boundary that classifies the two different regions (i.e. acceptance region and rejecting region). The critical value is a point on the distribution of the test statistic under the null hypothesis that defines a set of values that call for rejecting the null hypothesis. This set is called critical value or rejection region. The critical value is a very useful and important concept used in statistics problems.
In this article, we will be studying critical value, its various methods, and types of critical value, and for better understanding, we solve some examples here.
Introduction of Critical value:
The critical value is defined as the value that determines whether the null hypothesis is rejected or accepted in the testing of a null hypothesis is called the critical value.
Example:
Let the Calculated value from the data is 2.71 but the critical value (Finding from Critical value Table) is 3.86 then we can see that our calculated value is less than the critical value so the null hypothesis is lying in the acceptance region then we accept null hypothesis otherwise we reject the null hypothesis.
Tests Type:
There are two types of tests:
- One tail test
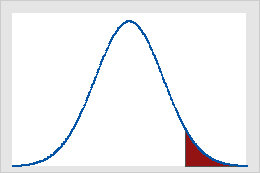
Here Shaded part shows the rejecting region lying on one side.
- Two Tail test
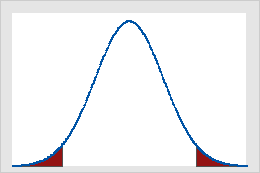
Here we can see that the shaded part lies on both sides that’s why this is called two tails test.
Steps of Finding Critical value:
These are the following steps for finding critical value:
- Subtract the confidence level from 100% to find out the level of significance.
- Convert the percentage value to decimal to find “?”.
- If the test is one tail then the value of “?” use as it is otherwise if the test is two tails then “?” is divided by 2 and we get “?/2”.
- (n – 1) use to find the degree of freedom.
- We use the corresponding table to find out critical values depending on the test type with the help of “?” and degree of freedom.
Criteria:
Acceptance or rejection Criteria of null hypothesis:
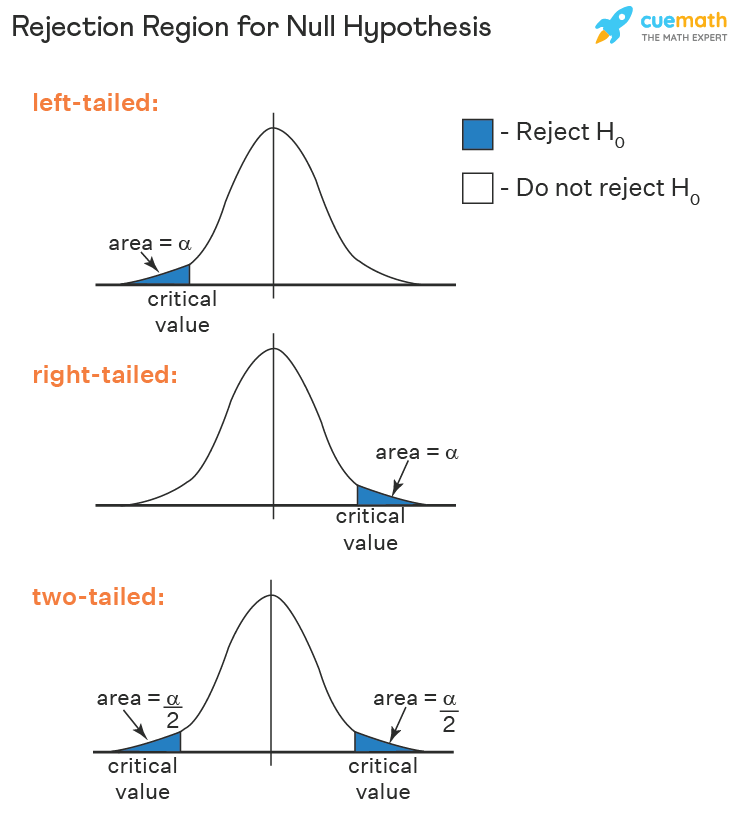
- For the Right one-tail test: if the calculated value is greater than the table value then we reject the Null hypothesis “Ho”.
- For the Left one tail test: if the calculated value is less than the table value then we reject the Null hypothesis “Ho”.
- For both two tails test: The null hypothesis “Ho” is rejected if the calculated value does not lie in the acceptance region.
Different methods of Critical Value:
There are the following methods of finding critical value:
- T critical value
- Z Critical value
- F Critical value
- Chi-square Critical value
T Critical Value:
T Critical value calculate in T-Test also known as “Student’s T-Test” when the sample size “n” less than 30 is given in the data.
These are the following steps to calculate the T Critical value:
- Find “?” level of significance.
- Find the degree of freedom by using the (n – 1) formula.
- If the test is one tail we use one tail distribution table otherwise two tails distribution table.
- To find out the table we see “?” from the top columns and the degree of freedom in the left column’s row, interception of “?” and “df” is given the table value/ critical value.
Formulas:
- Degree of freedom (df) = n – 1 where “n” is the sample size
- For one Sample test: t = ( – µ) / (s / ?n) “s” is the sample standard deviation
- For two Samples test: t = {(– ) – (?1 – ?2)} / ? {((s1)2 / n1) + ((s2)2 / n2)}
Z Critical Value:
Z Critical value calculated in the Z test when the sample size is greater than or equal to 30 given in data.
These are the following steps to calculate the Z Critical value:
- Find “?” Level of significance.
- For one tail test subtract alpha “?” from 1 otherwise subtract alpha from 0.5 for the two tails test.
- Find the degree of freedom by using the (n – 1) formula.
- Use the Z table to find out the Z Critical value.
Formulas:
- Degree of freedom (df) = n – 1 where “n” is the sample size
- For one tail test: Z = ( – µ) / (? / ?n) ? is the population standard deviation
- For two-tail tests: Z = {( – ) – (?1– ?2)} / ? {((?1)2/ n1) + ((?2)2 / n2)}
F Critical Value:
F Critical value is calculated in the F test mostly used in ANOVA analysis of variance and also used to compare the variance of two samples.
These are the following steps to calculate F Critical value:
- Find “?” level of significance.
- Subtract 1 from the size of the first sample this is called the first degree of freedom say, x
- Similarly, subtract 1 from the second sample this is called the second degree of freedom say, y
- Using the F distribution table to calculate the critical value (intersect x and y rows to obtain value)
Formulas:
- Degree of freedom: x = n1 – 1, y = n2 – 1
- For a small sample: F = (s1)2 / (s2)2
{(s1)2 is the variance of the first sample and (s2)2 is a variance of the second sample}
- For large sample: F = (?1)2 / (?2)2
{(?1)2 is the variance of the first population and (?2)2 is a variance of the second population}
Chi-Square Critical Value:
Chi-Square Critical value calculated in the Chi-Square test is used to determine the relation between two variables if they are related.
These are the following steps to calculate Chi-Square Critical value:
- Find alpha “?” (level of significance).
- Subtract 1 from the sample size to find a degree of freedom (df).
- Use a Chi-Square distribution table to find critical values (intersect row and column)
Formulas:
- Degree of freedom (df) = n – 1 where “n” is the sample size
- X2 = ? (Oi – Ei)2 / Ei
How to find critical value?
Here are a few solved examples to learn how to find critical value.
Example 1:
Calculate the critical value Z Left tail test if ? = 0.012.
Solution:
Step 1: Find a confidence level
Subtract ? form 0.5, thus
Level of confidence = 0.5 – 0.012
Level of confidence = 0.488
Step 2: Using the Z table Find the table value
Z = 2.26
Step 3: Conclusion
Because the test is left tail then the critical value become -2.26
Example 2:
With the sample size of 27 at a level of significance alpha = 0.05
Solution:
Step 1: level of significance
n = 27
=0.05
Step 2: Degree of freedom
Df = n – 1
Df = 27 – 1
Df = 26
Step 3: Find the value from the table
Using one tail T distribution table at n = 26 and = 0.05 is 1.7056
Step 4: Conclusion
Critical value = 1.7056
Summary:
In this article, we discussed the definition of critical value, how many types of tests, the procedure for finding critical value, and the acceptance and rejection of null hypothesis criteria.
We also discussed different methods of finding critical value i.e. T-Critical value, Z-Critical Value, F-Critical Value, and Chi-Square Critical value.